
CUET UG Geography Booster Test 2-Fundamentals of Data Analysis
📌 Answers are locked once submitted — results and explanations appear at the end.
QUESTION 1 OF 20
Consider the following analytical statements:
1. Facilitating data processing through proper presentation allows for accurate application of statistical averages.
2. Raw data inherently showcases the internal variations without the need for central tendency measures.
Which of the statements given above is/are correct?
QUESTION 2 OF 20
How does the organization of grouped data theoretically impact the precision of the calculated mean compared to ungrouped direct data?.
QUESTION 3 OF 20
Match the correct statistical formula to its analytical technique.
| List I | List II |
|---|---|
| 1. Mean (Direct Method, Ungrouped Data) | A. x̄ = Σx ÷ N |
| 2. Median (Grouped Data) | B. l + [(N ÷ 2 − Cf) ÷ f] × i |
| 3. Mode (Grouped Data) | C. l + [(f₁ − f₀) ÷ (2f₁ − f₀ − f₂)] × i |
| 4. Arithmetic Mean (Grouped Data) | D. Σ(fx) ÷ Σf |
QUESTION 4 OF 20
If a geographer only applies a measure of central tendency to rainfall data, what crucial aspect of the dataset remains unknown?.
QUESTION 5 OF 20
Identifying the __________ of association between variables like rainfall and elevation distinguishes measures of relationship from measures of central tendency.
QUESTION 6 OF 20
While mean and median evaluate single datasets, estimating how closely fertiliser consumption fluctuations match crop yield fluctuations requires techniques that analyse _________.
QUESTION 7 OF 20
Arrange the analytical procedure for identifying the central tendency using the Indirect method for ungrouped data:
1. Add the assumed mean to the sum of deviations divided by N.
2. Identify a constant (assumed mean) near the middle of the dataset.
3. Calculate the deviation (d) for each observation.
QUESTION 8 OF 20
Consider the following statements:
1. The median is completely independent of the actual individual values in a series once ordered.
2. The central tendency value lies strictly at the mathematical midpoint, regardless of extreme value skewness.
Which is/are correct?
QUESTION 9 OF 20
The validity of describing a central tendency as the "point of clustering" breaks down most visibly in which specific data scenario?.
QUESTION 10 OF 20
Using the indirect method, an operation known as __________ reduces the value of observations to smaller numbers by subtracting a constant.
QUESTION 11 OF 20
Consider the following regarding geographical data:
1. In calculating the median for varying elevations (grouped), 'c' represents the cumulative frequency of the pre-median class.
2. 'f' represents the sum of all frequencies in the dataset.
Which is/are mathematically correct according to the formula?
QUESTION 12 OF 20
Why is the median particularly robust for analyzing highly skewed geographical data (like extreme wealth or elevation peaks) compared to the mean?
QUESTION 13 OF 20
QUESTION 14 OF 20
QUESTION 15 OF 20
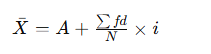
Match the variables from the Grouped Data Mean Indirect Formula
| List I | List II |
|---|---|
| 1. d | A. Assumed mean |
| 2. i | B. Total frequency |
| 3. A | C. Deviation from the assumed mean |
| 4. N | D. Class interval width |
QUESTION 16 OF 20
Arrange the steps for finding the Median of Grouped Data.
1. Find the cumulative frequency (Cf) of the class preceding the median class.
2. Substitute the values into the median formula: Median = l + [(N ÷ 2 − Cf) ÷ f] × i
1. Calculate N ÷ 2 to identify the median class..
QUESTION 17 OF 20
Consider the calculation of Mean for grouped data using the direct method:
1. All values of fx are added to obtain ∑fx.
2. The mean is ∑fx divided by N (where N = ∑f).
Which statements are correct?
QUESTION 18 OF 20
If density variation data shows a recurrence of many different measures equally throughout a series, making it highly varied without a single clear peak, the series is analytically designated as:
QUESTION 19 OF 20
When minimizing the magnitude of computation for internal data variations in grouped data, the assumed mean (A) is theoretically selected from which location?.
QUESTION 20 OF 20
Finding the cumulative frequencies (F) by adding successive interval groups is a required internal data processing step when computing the __________ for grouped data.
Test Complete!
Answer Review
1 Consider the following analytical statements:
1. Facilitating data processing through proper presentation allows for accurate application of statistical averages.
2. Raw data inherently showcases the internal variations without the need for central tendency measures.
Which of the statements given above is/are correct?
Organising and presenting jumbled figures into a clear table or graph establishes a systematic structure. This foundation enables researchers to compute statistical averages accurately. Raw unorganized field data consists of a confusing mass of digits that obscures trends. Unprocessed records hide internal patterns instead of showcasing them clearly.
Statement 1 is completely accurate. Raw geographical measurements are collected as a chaotic block of digits. Systematically organizing and presenting this information in data matrices, frequency distributions, or tables streamlines workflows and ensures the accurate calculation of statistical averages like the mean, median, or mode. Statement 2 is false. Raw data does not inherently showcase internal variations or structural features clearly. Instead, it obscures variations under a wall of numbers. To uncover and contextualize internal differences, analysts must apply statistical measures such as central tendency as a baseline, followed by dispersion techniques.
- Option A: This option is incorrect because it accepts Statement 2, which wrongly claims that unorganized data clearly displays internal variations on its own.
- Option C: This option is incorrect because it validates Statement 2, failing to recognize that raw numbers must be processed to reveal patterns.
- Option D: This option is incorrect because it rejects Statement 1, ignoring the fact that proper data formatting is what makes advanced statistical calculations possible.
used
- Extreme Language/Keywords
Application:Analyzing the word "inherently" in Statement 2 alerts you to a sweeping conceptual claim. Raw information rarely reveals structural characteristics without processing.
Final Logic: Eliminating the flawed second statement leaves Statement 1 only as the correct choice.
Structured presentation enables accurate processing (1 is true) + Unorganized data hides patterns (2 is false).
2 How does the organization of grouped data theoretically impact the precision of the calculated mean compared to ungrouped direct data?.
Sorting items into class intervals removes the unique values of individual numbers. Calculations run on tables substitute the midpoint of a class row for all values inside it. This substitution introduces a grouping effect that changes the exact precision of the mean.
Calculating a mean from raw, ungrouped data maintains perfect mathematical precision because every single unique observation is added into the calculation. However, grouping data into class intervals alters precision. During this formatting step, individual data values lose their unique identity because they are merged into class blocks. When calculating the mean from a table, we use the midpoint of each class row to represent all values in that category. This introduces a slight rounding or grouping effect, meaning the result may vary slightly from the raw data average.
- Option A: Grouped data calculations rely heavily on midpoints rather than avoiding them, and grouping reduces individual precision rather than improving it.
- Option C: Grouping data changes the calculation values, creating a small mathematical difference that cannot be completely neutralized by the formula.
- Option D: Calculating the mean of a grouped dataset is straightforward using the direct method; it does not require the indirect shortcut method.
used
- Contextual/Tonal Matching
Application: Linking the structural loss of individual data points with its mathematical effect helps identify the option that notes the role of class midpoints.
Final Logic: Grouping data alters precision because unique values are replaced by class midpoints.
Grouped data = Hidden unique values = Replaced by midpoints = Alters precision.
3 Match the correct statistical formula to its analytical technique.
| List I | List II |
|---|---|
| 1. Mean (Direct Method, Ungrouped Data) | A. x̄ = Σx ÷ N |
| 2. Median (Grouped Data) | B. l + [(N ÷ 2 − Cf) ÷ f] × i |
| 3. Mode (Grouped Data) | C. l + [(f₁ − f₀) ÷ (2f₁ − f₀ − f₂)] × i |
| 4. Arithmetic Mean (Grouped Data) | D. Σ(fx) ÷ Σf |
The mean for ungrouped data is obtained by dividing the sum of observations by the total number of observations. The grouped median is calculated using the median class and interpolation formula. The grouped mode is calculated using the modal class formula. The grouped arithmetic mean is calculated using frequencies and corresponding values.
Different statistical measures use different standard formulas. The Mean (Direct Method, Ungrouped Data) (1-A) is calculated as x̄ = Σx ÷ N, where Σx is the sum of all observations and N is the total number of observations. The Median (Grouped Data) (2-B) is calculated using l + [(N ÷ 2 − Cf) ÷ f] × i, where l is the lower boundary of the median class, Cf is the cumulative frequency before the median class, f is the frequency of the median class, and i is the class interval. The Mode (Grouped Data) (3-C) uses the standard modal formula, while the Arithmetic Mean (Grouped Data) (4-D) is calculated as Σ(fx) ÷ Σf. Therefore, the correct matching is 1-A, 2-B, 3-C, 4-D, making Option B the correct answer.
- Option A incorrectly exchanges the formulas for the mean and median and mismatches the remaining formulas.
- Option C incorrectly assigns the grouped mean and mode formulas to the wrong statistical techniques.
- Option D incorrectly pairs all four techniques with inappropriate formulas.
Used
- Formula Recognition
Application: Match each statistical technique with its standard textbook formula.
Final Logic: The ungrouped mean, grouped median, grouped mode, and grouped arithmetic mean each have unique formulas, confirming Option B.
Quick Recall: Mean = Average, Median = Middle, Mode = Most Frequent.
4 If a geographer only applies a measure of central tendency to rainfall data, what crucial aspect of the dataset remains unknown?.
A central average simplifies a distribution into a single middle value. This single number can obscure how widely individual weather events differ from each other. To track this spread, analysts must use dispersion tools rather than just an average.
Measures of central tendency only find the center point where values cluster, but they hide how spread out the rest of the data is. If a geographer only calculates a central average for rainfall data, the internal variations around the average remain unknown. Two regions can have the exact same average annual rainfall, yet one might experience steady showers while the other faces extreme droughts and severe floods. Revealing these differences requires measuring dispersion.
- Option A: The single representative cluster point is the central tendency itself, which is exactly what the geographer has already calculated.
- Option B: The total sum of observations is found during the calculation of the mean, so it is already known.
- Option D: The number of occurrences represents the total count of observations, which is required to compute the central average.
used
- Contextual/Tonal Matching
Application: Identifying that central tendency only tracks the middle point helps you look for an option that describes what averages miss—the spread or variation of the data.
Final Logic: Averages fail to show the internal variation of a dataset, which requires dispersion metrics.
Averages locate the center baseline →They leave the Internal variation (spread) completely hidden.
5 Identifying the __________ of association between variables like rainfall and elevation distinguishes measures of relationship from measures of central tendency.
Central metrics focus on locating a single middle value for individual variables. Interacting geographic features require analyzing how they change together. The strength of this connection is defined as the degree of association.
Measures of relationship focus on how different geographical features interact, rather than just finding the center of a single dataset. Identifying the degree of association between interacting variables (such as how rainfall changes at different elevations) distinguishes relationship measures from central tendency. This calculation tells analysts how strongly or weakly the variables are linked.
- Option A: Deviation measures how far data points drift from a central baseline, which is a feature of dispersion rather than relationship tools.
- Option C: A midpoint is the center value of a class row in a frequency table, which is used for grouped data calculations.
- Option D: Distribution refers to the overall layout of data points across categories, not the strength of the link between two separate variables.
used
- Contextual/Tonal Matching
Application: Matching the word "association" with its textbook definition focuses attention on the term used to describe the strength of a relationship: degree.
Final Logic: Measures of relationship calculate the degree of association between variables.
Measuring a relationship link = Finding the strength of the connection = Checking the Degree of association.
6 While mean and median evaluate single datasets, estimating how closely fertiliser consumption fluctuations match crop yield fluctuations requires techniques that analyse _________.
Tracking how changes in one variable correspond to changes in another requires specialized tools. Fertilizer inputs and crop outputs are interacting geographic phenomena. This joint movement is analyzed by measuring their degree of association.
While single metrics like the mean or median describe a single dataset, they cannot show how two different variables interact. To track how variations in fertilizer use correspond to changes in crop yields, geographers use tools that analyze the degree of association between related phenomena. Techniques like correlation coefficients calculate how closely these separate variables change together.
- Option A: Measures of central tendency calculate separate averages for fertilizer or crop yields, failing to show the connection between them.
- Option B: Ideal representative observations are the single center values found by averages, not tools for studying interactions.
- Option D: Internal dispersion clustering is a mixed phrase that does not describe standard tools for analyzing relationships between variables.
used
- Contextual/Tonal Matching
Application: Recognizing that the prompt focuses on matching fluctuations between two separate variables helps you choose an option designed for multi-variable relationships.
Final Logic: Comparing how two variables change together requires analyzing the degree of association between related phenomena.
Matching fluctuations between two variables = Analyzing a connection = Degree of association between related phenomena.
7 Arrange the analytical procedure for identifying the central tendency using the Indirect method for ungrouped data:
1. Add the assumed mean to the sum of deviations divided by N.
2. Identify a constant (assumed mean) near the middle of the dataset.
3. Calculate the deviation (d) for each observation.
The shortcut calculation method begins by choosing a temporary guess number near the middle of the range. Next, you subtract this chosen guess from each individual entry to find the deviations. Finally, these adjusted differences are run through the formula to calculate the true mean.
The indirect method for calculating the mean of an ungrouped list follows a specific mathematical sequence. First, you choose a baseline by identifying a constant (assumed mean) near the middle of your dataset (2). Second, simplify the values by calculating the deviation for each observation using the formula: d = X − A (Step 3). Third, substitute the calculated values into the formula by adding the assumed mean (A) to the sum of deviations divided by the total number of observations (N) (Step 1). This establishes 2, 3, 1 as the correct logical order.
- Option A: This option tries to compute the final formula (step 1) before choosing a guess baseline or adjusting the raw data points.
- Option C: This sequence suggests calculating deviations before choosing the baseline number you need to subtract from the data.
- Option D: This option is incorrect because it attempts to run the final formula (step 1) before calculating the adjusted differences for the dataset (step 3).
used
- Option Grouping
Application: Knowing that choosing an assumed mean baseline (step 2) must be the absolute first step narrows the choices down to Option B or D.
Final Logic: Since you must calculate the deviations (step 3) before running the final formula (step 1), the correct sequence must be 2-3-1.
Choose a guess baseline (2) →Find the differences (3) →Run the final formula (1).
8 Consider the following statements:
1. The median is completely independent of the actual individual values in a series once ordered.
2. The central tendency value lies strictly at the mathematical midpoint, regardless of extreme value skewness.
Which is/are correct?
Positional averages rely on order and placement rather than the exact values of the data points. Changing an extreme value on the edge does not alter the middle position of a sorted list. Highly skewed data shifts the mean away from the visual center, making Statement 2 false.
Statement 1 is entirely correct. The median is a positional average. Once a dataset is arranged in order, the median is determined solely by the value at the center position. Changing individual values at the high or low ends of the list will not alter the median as long as their position remains the same. Statement 2 is false. A central tendency value does not stay anchored at the mathematical midpoint when data is skewed. An asymmetrical pull from extreme values shifts the arithmetic mean away from the center, meaning the averages will no longer align.
- Option A: This option is incorrect because it rejects Statement 1, failing to recognize that the median depends on position rather than edge values.
- Option B: This option is incorrect because it accepts Statement 2, which wrongly claims that data skewing does not shift central averages.
- Option C: This option is incorrect because it validates Statement 2, ignoring the fact that extreme values pull the mean away from the center.
used
- Contextual/Tonal Matching
Application: Recognizing that extreme values pull the mean away from the center helps you quickly spot the error in Statement 2, leaving Statement 1 as the correct choice.
Final Logic: Since the median is positional and skewness shifts averages, only Statement 1 is correct.
The median relies on center position, not edge values (1 is true) + Skewed data shifts averages (2 is false).
9 The validity of describing a central tendency as the "point of clustering" breaks down most visibly in which specific data scenario?.
A central average works well when data points naturally gather around a middle baseline. If a dataset features a severe tilt and no values repeat, the data points are spread out evenly. This layout prevents data from clustering, which makes a central average less representative.
An average works well as a representative "point of clustering" because most datasets have values that naturally gather around the middle. However, this description breaks down when a distribution has no repeating values (no mode) and is highly skewed. In this scenario, the data points are spread out unevenly across a wide range without gathering at any single point. This makes a central average a poor representation of the actual distribution.
- Option A: A unimodal normal curve is perfectly balanced, meaning data clusters right in the center where the average sits.
- Option C: The direct method is simply a calculation choice; it does not change how data points cluster in a sample.
- Option D: Grouped midpoints are used to simplify calculations for tables; they do not cause the concept of central clustering to break down.
used
- Contextual/Tonal Matching
Application: Finding a scenario where data points do not gather together directs attention to options that feature a high skew and no repeating values.
Final Logic: A high skew combined with no repeating values prevents data from clustering, making a central average less effective.
No repeating values + Severe tilt = Scattered data = No point of clustering exists.
10 Using the indirect method, an operation known as __________ reduces the value of observations to smaller numbers by subtracting a constant.
Manually calculating large datasets can lead to tedious arithmetic and mistakes. To simplify the math, analysts can subtract a temporary guess value from each entry. This step of scaling large figures down to smaller numbers is called coding.
When working with a large dataset of high numbers, the direct calculation method can become tedious. To simplify the arithmetic, analysts use the indirect method. This workflow features an operation called coding, where a baseline constant (an assumed mean) is subtracted from each raw value. This scales the large observations down to smaller, manageable numbers, reducing calculation errors while still yielding the correct final answer.
- Option A: Skewing describes an asymmetrical tilt in a distribution curve, not a step used to simplify calculation numbers.
- Option B: Dispersing refers to the spread of data points away from the center, which describes variance rather than a data reduction technique.
- Option D: Centering is a general term for aligning data around a middle point, not the specific name for scaling numbers down in the indirect method.
used
- Contextual/Tonal Matching
Application: Matching the mathematical step of scaling down a dataset with standard statistical terminology points directly to coding.
Final Logic: The operation of reducing data values by subtracting a constant is called coding.
Subtracting a constant to shrink big numbers = Scaling the dataset = Coding.
11 Consider the following regarding geographical data:
1. In calculating the median for varying elevations (grouped), 'c' represents the cumulative frequency of the pre-median class.
2. 'f' represents the sum of all frequencies in the dataset.
Which is/are mathematically correct according to the formula?
The grouped median formula relies on a clear set of variable definitions. The variable 'c' tracks the total frequency accumulated up to the median class row. The variable 'f' represents only the specific frequency of the median class row itself.
Statement 1 is entirely correct. In the grouped median formula the variable c represents the cumulative frequency of the class row immediately preceding the median class. Statement 2 is incorrect. The variable f does not represent the sum of all frequencies. Instead, it represents only the simple frequency of the median class row itself, while the total sum of all frequencies is represented by n.
- Option A: This option is incorrect because it accepts the flawed second statement while rejecting the accurate first statement.
- Option C: This option is incorrect because it validates Statement 2, confusing a single row's frequency with the total frequency sum.
- Option D: This option is incorrect because it rejects Statement 1, which correctly defines how the variable c is used in the formula.
used
- Contextual/Tonal Matching
Application: Reviewing the exact textbook definitions for the grouped median formula shows that f is a single class frequency and n is the total sum, making Statement 2 false.
Final Logic: Since Cf represents the cumulative frequency before the median class and f represents the frequency of the median class, only Statement 1 is correct.
c = Cumulative frequency of the previous class row (1 is true) + f = Frequency of just the median row (2 is false).
12 Why is the median particularly robust for analyzing highly skewed geographical data (like extreme wealth or elevation peaks) compared to the mean?
Calculating an arithmetic mean requires adding up all data values, including outliers. A single extreme outlier can pull the mean away from the true center. A positional average relies on rank order, keeping it unaffected by extreme values on the edges.
The arithmetic mean is highly sensitive to extreme outliers because its formula adds up every single value in the dataset. A few extreme values (like high mountain peaks or concentrated wealth) will pull the mean away from the typical center. The median, however, is a positional average. It is found by sorting the dataset and locating the exact middle position, making it independent of the actual values at the extreme ends. This independence allows it to provide a more accurate representation of highly skewed data.
- Option A: Averaging the extremes is exactly what the mean does, which is why it fails to represent skewed data accurately.
- Option C: Measuring the degree of association describes what relationship tools do, which does not explain why the median handles outliers well.
- Option D: Multimodal clustering describes datasets with multiple peak frequencies, which is related to the mode rather than the positional strength of the median.
used
- Contextual/Tonal Matching
Application: Matching the value of the median with its positional definition helps identify why it remains unaffected by outliers at the edges of a dataset.
Final Logic: The median handles skewed data well because it is a positional average that does not calculate edge values.
Median looks at position, not value size = Splitting a sorted list in half ignores extreme edge numbers.
13
The provided text outlines workflows for calculating the arithmetic mean. The final sentence notes that the indirect method is preferred for large datasets. This shortcut method works by using a subtracted constant to scale down the raw values.
The passage states that "For a large number of observations, the indirect method is normally used." In data analysis frameworks, this choice is made because direct addition of large numbers becomes tedious and prone to errors. The indirect method addresses this challenge by introducing an assumed mean constant, which is subtracted from each value. This steps codes the data down into smaller, more manageable numbers, simplifying the calculations while still providing the correct final answer.
- Option A: The indirect method still requires division by the total number of items (N) at the end of the calculation.
- Option C: Grouped and ungrouped data calculations require different formulas under both the direct and indirect methods.
- Option D: The indirect method calculates the exact arithmetic mean; it does not convert the result into a median.
used
- Contextual/Tonal Matching
Application: Connecting the passage's recommendation for large datasets with the underlying purpose of the indirect method points directly to data reduction and smaller numbers.
Final Logic: The indirect method is used for large datasets because it scales down raw values to simplify calculations.
Large dataset = Use a shortcut guess baseline to shrink values = Managing smaller numbers.
14
The text provides a clear explanation of the direct method for raw lists. Finding the mean requires adding up all individual observations first. This total sum is then divided by the count of items in the dataset.
The passage describes the direct method for ungrouped data, stating that "the values for each observation are added and the total number of occurrences are divided by the sum of all observations." Note that the phrasing in the passage contains an oversight, switching the positions of the divisor and dividend. To maintain mathematical consistency and align with the core text, finding the mean requires taking the sum of the observations and dividing it by the total number of occurrences (N). This makes Option A the correct choice.
- Option B: An assumed mean group is used in the shortcut indirect method, not the direct calculation method.
- Option C: Midpoints of class intervals are used to represent values in grouped tables, not raw ungrouped lists.
- Option D: Cumulative frequency is a running total column used to calculate the median or draw curves, not a tool for finding a mean.
used
- Contextual/Tonal Matching
Application: Scanning the text for the direct method for ungrouped data leads directly to the count of observations, or the total number of occurrences.
Final Logic: Calculating a direct mean requires dividing the sum of your values by the total number of occurrences.
Direct mean formula = Total sum of values / Count of items = Divided by total number of occurrences.
15 Match the variables from the Grouped Data Mean Indirect Formula
| List I | List II |
|---|---|
| 1. d | A. Assumed mean |
| 2. i | B. Total frequency |
| 3. A | C. Deviation from the assumed mean |
| 4. N | D. Class interval width |
d represents the deviation from the assumed mean. i represents the class interval width. A is the assumed mean. N represents the total frequency.
The Grouped Data Mean (Indirect or Assumed Mean Method) uses several variables with specific meanings. d (1-C) represents the deviation of the class midpoint from the assumed mean. i (2-D) represents the class interval width. A (3-A) denotes the assumed mean, which simplifies calculations. N (4-B) represents the total frequency, obtained by summing all class frequencies. Therefore, the correct matching is 1-C, 2-D, 3-A, 4-B, making Option B the correct answer.
- Option A incorrectly assigns the meanings of d, A, and N.
- Option C incorrectly exchanges the meanings of d, N, and A.
- Option D incorrectly matches the variables with inappropriate definitions.
Used
- Formula Recognition
Application: Match each variable with its standard definition used in the Assumed Mean Method.
Final Logic: d = Deviation, i = Class interval width, A = Assumed mean, and N = Total frequency, confirming Option B.
Quick Recall: d deviates, i is the interval, A is assumed, N is the total.
16 Arrange the steps for finding the Median of Grouped Data.
1. Find the cumulative frequency (Cf) of the class preceding the median class.
2. Substitute the values into the median formula: Median = l + [(N ÷ 2 − Cf) ÷ f] × i
1. Calculate N ÷ 2 to identify the median class..
Finding the median from a frequency table requires a systematic, step-by-step approach. First, you divide the total frequency in half to locate the median class row. Next, you check the running totals column to find the accumulated frequency of the previous row. Finally, you plug all these values into the interpolation formula to find the answer.
The median of grouped data is calculated in a logical sequence. First, compute N ÷ 2 to determine the position of the median and identify the median class (Step 3). Next, obtain the cumulative frequency (Cf) of the class immediately preceding the median class (Step 1). Finally, substitute the values of l, Cf, f, i, and N into the formula: Median = l + [(N ÷ 2 − Cf) ÷ f] × i to calculate the median (Step 2). Therefore, the correct sequence is 3 → 1 → 2, making Option B the correct answer.
- Option A: Incorrect because the cumulative frequency cannot be identified before calculating N ÷ 2 and locating the median class.
- Option C: Incorrect because it attempts to use the median formula before identifying the median class and collecting the required values.
- Option D: Incorrect because it substitutes values into the formula before obtaining the cumulative frequency of the preceding class.
Used
- Sequential Procedure
Application: Follow the standard textbook procedure for calculating the grouped median.
Final Logic: Calculate N ÷ 2 → Find the preceding cumulative frequency (Cf) → Apply the median formula, confirming Option B.
Quick Recall: Locate → Identify → Calculate.
17 Consider the calculation of Mean for grouped data using the direct method:
1. All values of fx are added to obtain ∑fx.
2. The mean is ∑fx divided by N (where N = ∑f).
Which statements are correct?
Calculating the mean of grouped data requires considering the frequency of each class. Multiply each class midpoint (x) by its frequency (f) to obtain fx. Add all the fx values and divide the total by the total frequency (N or Σf) to calculate the mean.
Both statements correctly describe the Direct Method for calculating the arithmetic mean of grouped data. Statement 1 is true because each class midpoint (x) must be multiplied by its corresponding frequency (f) to obtain fx, and all the fx values are then added to calculate Σfx. Statement 2 is also true because the arithmetic mean is obtained by dividing Σfx by the total frequency (Σf or N). The standard formula is: Arithmetic Mean = Σfx ÷ Σf or equivalently, Arithmetic Mean = Σfx ÷ N where N = Σf. Therefore, both statements are true, making Option C the correct answer.
- Option A: Incorrect because Statement 2 correctly explains the final step of dividing Σfx by Σf (or N).
- Option B: Incorrect because Statement 1 correctly explains how to calculate Σfx.
- Option D: Incorrect because both statements describe the standard procedure for calculating the arithmetic mean of grouped data.
Used
- Concept Verification
Application: Compare each statement with the standard steps of the Direct Method for calculating the arithmetic mean of grouped data.
Final Logic: Since one statement explains how to obtain Σfx and the other explains how to calculate the final mean, both statements are correct, confirming Option C.
Quick Recall: Multiply → Add → Divide
18 If density variation data shows a recurrence of many different measures equally throughout a series, making it highly varied without a single clear peak, the series is analytically designated as:
The mode represents the value that appears most frequently in a dataset. Most basic distributions feature a single clear peak frequency. When multiple separate values tie for the highest count, the dataset has many modes.
The mode represents the value that appears most often in a dataset. While many simple datasets have a single clear peak frequency, some complex distributions feature multiple different values that tie for the highest count. In this scenario, because the population density data shows many different values recurring equally without a single clear peak, the distribution is classified as multimodal.
- Option A: Unimodal describes a standard dataset that has only one clear peak frequency, which is the opposite of the scenario described.
- Option C: A normal distribution follows a balanced, bell-shaped curve with a single peak right in the middle, rather than multiple repeating peaks.
- Option D: Symmetrically skewed is a contradictory phrase; a dataset is either balanced (symmetrical) or tilted toward one side (skewed).
used
- Contextual/Tonal Matching
Application: Using the prefix "multi-" (meaning many) to match the phrase "many different measures equally recurring" points directly to Option B.
Final Logic: A dataset that features multiple peak frequencies is defined as multimodal.
One peak frequency = Unimodal; Many repeating peak frequencies = Multimodal.
19 When minimizing the magnitude of computation for internal data variations in grouped data, the assumed mean (A) is theoretically selected from which location?.
The Assumed Mean (Indirect) Method simplifies calculations by selecting a suitable assumed mean. Choosing an assumed mean near the centre of the data distribution keeps deviations small. Smaller deviations make calculations quicker and reduce the chance of errors.
When using the Assumed Mean (Indirect) Method to calculate the arithmetic mean of grouped data, selecting an appropriate assumed mean (A) simplifies the calculations. An assumed mean chosen from a class midpoint near the centre of the distribution produces relatively small positive and negative deviations. These smaller deviations are easier to calculate and sum, making the computation more efficient and reducing the possibility of calculation errors. Therefore, selecting an assumed mean near the middle of the dataset is the preferred approach.
- Option A: Incorrect because selecting a class with the lowest frequency does not necessarily simplify the calculations and may result in larger deviations.
- Option C: Incorrect because choosing the highest class midpoint usually produces large deviations, making calculations more difficult.
- Option D: Incorrect because the final cumulative frequency (N or Σf) represents the total frequency, not the most suitable value for selecting an assumed mean.
Used
- Concept Verification
Application: Apply the standard principle of the Assumed Mean Method, which recommends selecting an assumed mean near the centre of the distribution.
Final Logic: An assumed mean near the middle produces smaller deviations and simplifies calculations, confirming the correct answer.
Quick Recall: Middle Mean = Minimum Mathematics.
20 Finding the cumulative frequencies (F) by adding successive interval groups is a required internal data processing step when computing the __________ for grouped data.
Locating a positional center point within a frequency table requires tracking running totals. A cumulative frequency column shows how counts accumulate row by row. This column is used to find where the exact middle case lands.
To find the median from a grouped frequency table, you must build a running totals column by adding up the frequencies of successive class intervals.Once you find the median class row, you can use these cumulative counts in the interpolation formula to calculate the final answer. This is the formula
- Option A: The direct and indirect formulas for calculating a mean use simple class frequencies and midpoints; they do not require a cumulative frequency column.
- Option B: Finding the mode of a grouped table focuses on locating the single row with the highest frequency count, rather than building running totals.
- Option D: Basic dispersion metrics like range or mean deviation are calculated using midpoints and regular frequencies, without requiring cumulative tracking.
used
- Contextual/Tonal Matching
Application: Matching the use of "cumulative frequencies" with standard table formulas points directly to the median as the tool that relies on running totals.
Final Logic: Building a cumulative frequency column is a required step for calculating a grouped median.
Running total counts = Cumulative frequency column = Required tool to find the Median.